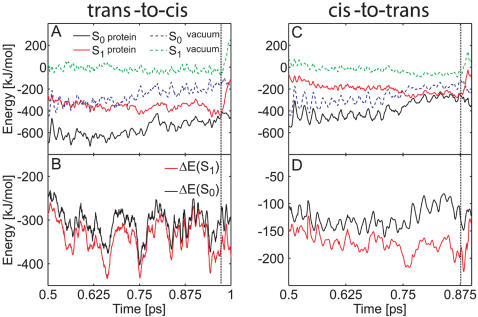
Figure 4. Influence of the protein environment on the photoisomerization process of the neutral asFP595 chromophore.
(A, C) Ground and excited state energies along trans-to-cis (A) and cis-to-trans (C) isomerization trajectories (run b, Table 1 and run a, Table 2). The protein environment stabilizes S0 and S1 (black and red lines, respectively) relative to the gas phase (dashed blue and green lines, respectively). (B, D) Energy difference between the protein and the gas phase. ΔE(S0) = E(S0, protein)−E(S0, gas phase) is plotted in black, ΔE(S1) = E(S1, protein)−E(S1, gas phase) in red. The protein environment energetically stabilizes S1 more strongly than S0. The vertical dashed black line represents the surface crossing. The energy offset in (A) and (C) is 1.9699×10⁶ kJ/mol.

