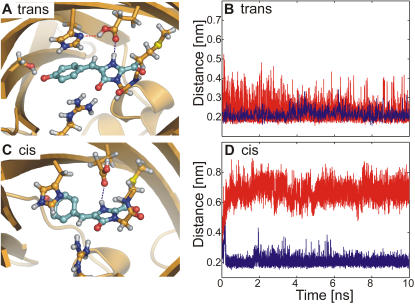
Figure 6. Hydrogen bonding network in the chromophore cavity during force field simulations of zwitterionic chromophores.
(A, C) Snapshots from MD simulations of Ztrans and Zcis, respectively. The blue dashed lines indicates the distance between the NH proton of MYG and Glu215, and the red dashed line that between the OH-group of Glu215 and the Nδ atom of His197. (B, D) Time-evolution of the two hydrogen bonds shown in (A) and (C) during representative force field MD simulations.

