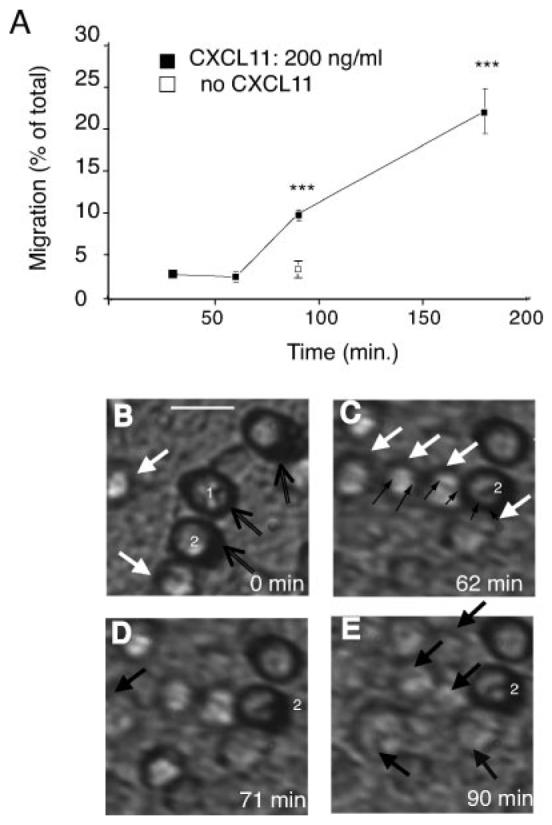
FIGURE 5.

Live cell imaging and fixed cell analysis of the different stages of transepithelial migration. Data are expressed as mean ± SD of triplicates, and one representative experiment of three is shown. The p values were calculated using a two-tailed Student's t test; ***, p < 0.001. A, Time course of transepithelial migration across an inverted epithelial monolayer. B–E, Time course video imaging of T lymphocytes during transepithelial migration. B, White arrows mark T cells on the basal surface of the epithelium. Open black arrows mark the 8-μM pores in the filter that are out of focus and through which the T cells have already passed. Two of these pores have been labeled “1” and “2” in white. C, The epithelial junctions can be seen and one section is marked with small black arrows. D and E, T cells that have successfully undergone transepithelial migration move out of the plane of focus and are labeled with closed black arrows. Scale bar, 10 μm. Complete set of images is available in Supplementary Video 1 online.
