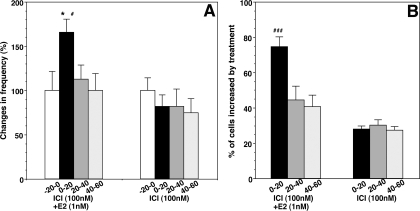
Figure 8.
Changes in the frequency of [Ca2+]i oscillations (A) and the percentage (B) of stimulated LHRH-1 neurons induced by E2 in the presence of ICI. Note that ICI did not block the E2-induced increase in the frequency of [Ca2+]i oscillations or the percentage of excited cells. The n for ICI plus E2 and ICI are 180 and 186, respectively. *, P < 0.05 vs.−20 to 0; #, P < 0.05; ###, P < 0.001 vs. ICI alone at the corresponding time.

