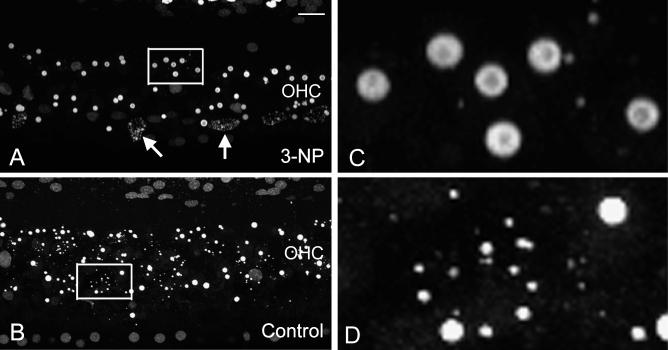
Figure 5.
Examples of nuclear morphologies in a 3-NP treated cochlea (A) and an artificial perilymph-treated control ear (B) after the noise exposure. Both cochlear sections show a large number of apoptotic nuclei. However, the extent of nuclei shrinkage is different. The 3-NP-treated ear is dominated by nuclear condensation. Only a few cells show nuclear fragmentation (arrows). In contrast, the perilymph-treated control ear exhibits a large quantity of small nuclear fragments. C and D show the high-magnification views of the regions indicated by the squares in A and B, respectively. Bar: 20 μm. The labels of OHC in A and B indicate the OHC region.

