
Figure 7.
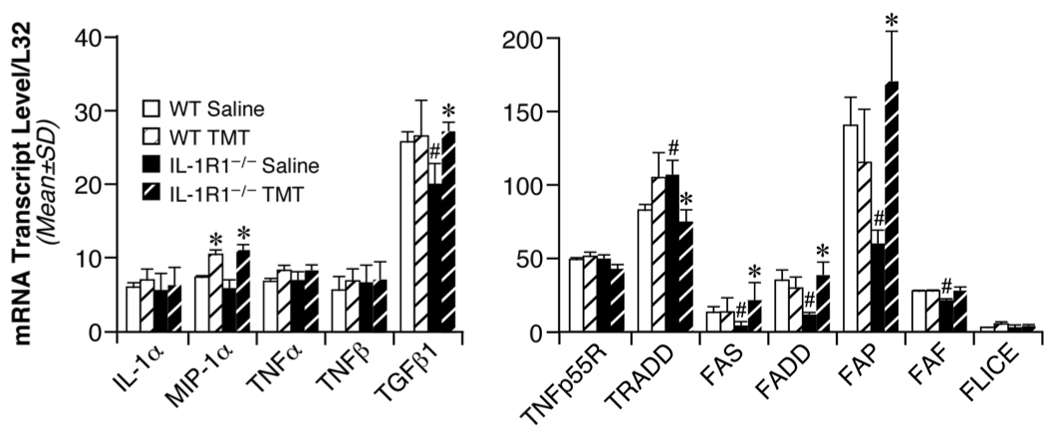
(Left) mRNA levels for inflammatory cytokines IL-1α, MIP-1α, TNFα, TNFβ, and TGFβ1 in the hippocampus of wildtype (WT) and IL-1R1 knockout (IL-1R1−/−) mice as determined by RNase Protection Assay (RPA) 24 hr post-TMT (2.0 mg/kg, i.p.). Data represent mean transcript level/L32 (+/− SD). (Right) mRNA levels for apoptotic genes TNFp55R, TRADD, Fas, FADD, FAP, FAF, and FLICE in the hippocampus of wildtype (WT) and IL-1R1 knockout (IL-1R1−/−) mice as determined by RNase Protection Assay (RPA) at 24 hrs post-TMT (2.0 mg/kg, i.p.). Data represent mean transcript level/L32 (+/− SD). #Significant difference between saline dosed WT and IL-1R1−/− mice. *Significant difference between saline and TMT-dosed mice within either the WT or IL-1R1−/− group (ANOVA; independent group mean analysis - Fisher’s LSD test, p<0.05; n=6).