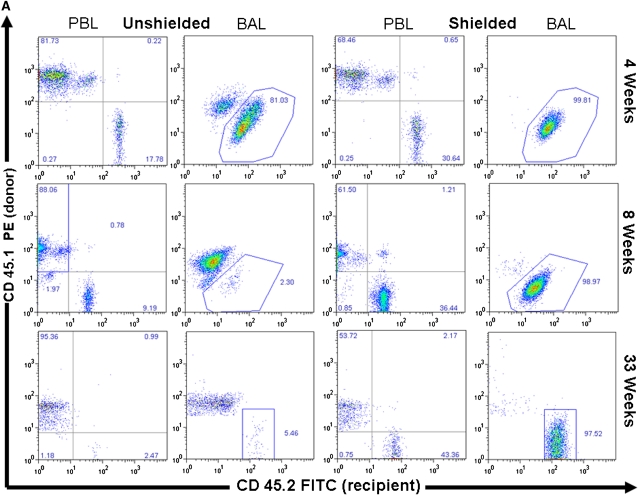
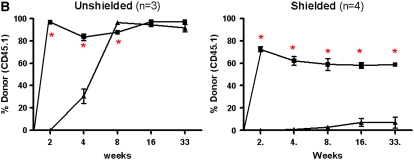
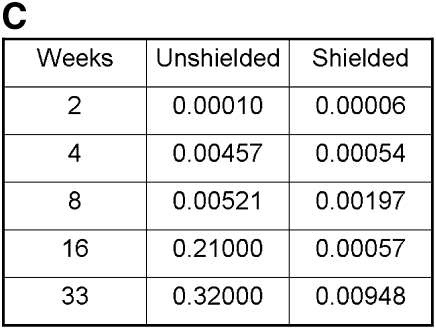
Figure 1.
Chimerism of peripheral blood leukocytes (PBL) and bronchoalveolar lavage (BAL) cells over time. (A) Representative flow cytometric analyses of donor (PE, y-axis) versus recipient (FITC, x-axis) chimerism in the PBL and BAL of shielded and unshielded animals at 4, 8, and 33 weeks after transplant. Boxed areas in BAL plots represent alveolar macrophages (AMs) of recipient phenotype. (B) Percent donor cells (CD45.1) in PBL (squares) and BAL (triangles) of unshielded and shielded mice 2 to 33 weeks after transplant. A paired two-tailed t test was used to compare PBL and BAL chimerism at each time point. *Statistically significant difference (P < 0.05). Number of animals for each time point is indicated except for Week 33, where n = 3 for shielded and n = 2 for unshielded animals. (C) Summary of P values for each time point.


