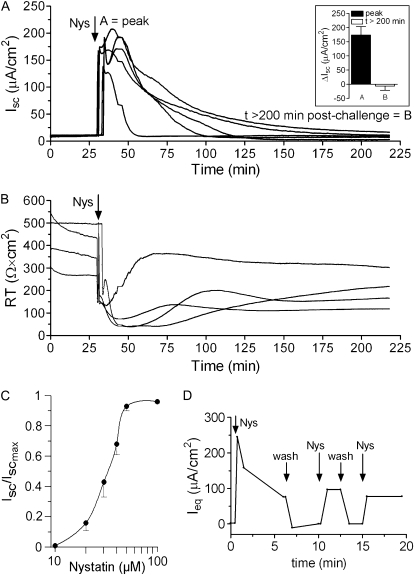
Figure 1.
Acute Nys challenge causes a dose-dependent Isc increase in primary HBE cells. (A) Representative Ussing chamber tracing illustrating the Isc (A) and RT (B) response of naïve HBEs to acute Nys challenge. Inset in A: bar graph showing average peak response (A) and t > 200 min after challenge values (B), mean ± SEM, n = 11. (C) Cumulative dose–response curve for the effect of Nys on Isc in naïve HBEs. Data are shown as mean ± SEM, n = 7. (D) Representative tracing for measurements of Ieq in a modified perfusion Ussing chamber. Arrows indicate changes of the mucosal perfusate (Nys = 40 μM Nys in KBR, wash = KBR).

