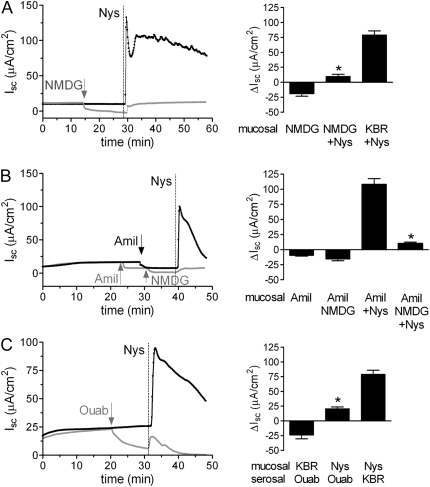
Figure 2.
Acute Nys challenge causes Na+ hyperabsorption in primary HBE cells. (A) Representative Ussing chamber tracings illustrating the Isc response of naïve HBEs to acute Nys challenge (Nys, vertical dashed line) after Na+ replacement (mucosal NMDG, gray tracing) or without Na+ replacement (black tracing). Compiled data from the experiment depicted in A are shown in the bar graph as mean ± SEM, n = 3 individual donors, 3 to 4 cultures/condition; *P < 0.0001 versus KBR+Nys. (B) Representative Ussing chamber tracings illustrating the Isc response to acute Nys challenge (Nys, vertical dashed line) of HBEs pretreated with amiloride (Amil, mucosal) and subjected or not to Na+ replacement with NMDG (gray and black tracing, respectively). Compiled data from the experiment depicted in B are shown in the bar graph as mean ± SEM, n = 3 individual donors, 3 to 4 cultures/condition; *P < 0.0001 versus Amil+Nys. (C) Representative Ussing chamber tracings illustrating the Isc response to acute addition of Nys (Nys, vertical dashed line) in ouabain-treated (Ouab, gray tracing) and untreated HBEs (black tracing). Compiled data from the experiments depicted in C are shown in the bar graph as mean ± SEM, n = 3 individual donors, 3 to 4 cultures/condition; *P < 0.0001 versus Nys/KBR. Average peak Isc responses to Nys are shown in all the bar graphs.

