Figure 6.
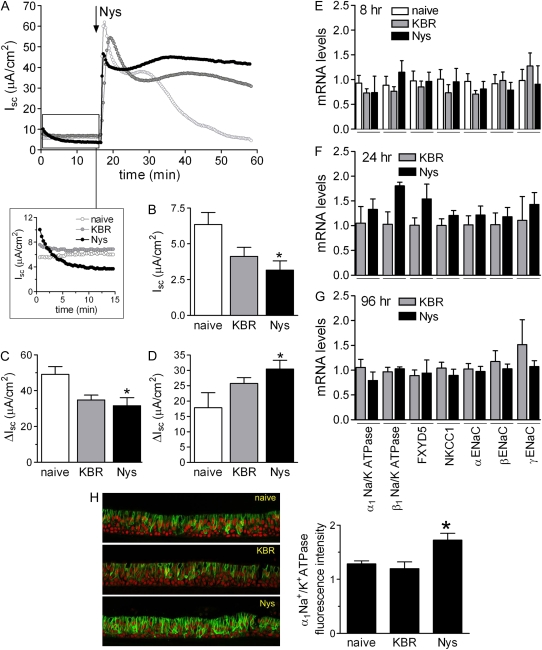
Chronic mucosal Nys treatment does not affect the bioelectric properties of primary HBE cells nor total mRNA abundance of transepithelial Na+ transport mediators. (A) Representative Ussing chamber tracings showing the effect of chronic Nys and KBR treatment on Isc. The enlarged panel shows the rapid loss (completed in ∼ 15 min) of chronic Nys effect (e.g., increased Isc) upon mounting of the cultures in a Nys-free mucosal bath. (B) Baseline Isc values 15 minutes after mounting naïve, KBR-, and Nys-treated culture in the chambers (data are shown as mean ± SD, n = 4 individual donors, 4 to 6 cultures for each treatment; *P = 0.01 versus naïve cultures). The arrow in Figure 1A indicates the acute addition of Nys in the apical chamber. (C) ΔIsc between peak value after acute Nys addition and baseline value (peak-basal); (D) ΔIsc value between the Isc value at 40 minutes and baseline value and (40min-basal). Data are expressed as mean ± SEM, n = 4 individual donors, 4 to 6 cultures for each treatment; *P < 0.05 versus naïve cultures. (E) Quantitative RT-PCR analysis of epithelial Na+ transport path components in naïve, KBR-, and Nys-treated cultures after 8 hours of treatment. Similar data were obtained at (F) 24 hours and (G) 96 hours of treatment. Data are shown as mean ± SEM, n = 2 individual donors, 4 cultures for each treatment. (H) Representative confocal images of naïve, KBR-, and Nys-treated HBE cultures immunostained for α1 Na+/K+ATPase. Quantification of the α1Na+/K+ATPase-specific signal is shown in the bar graph as mean ± SEM, n = 3 individual donors, 2 cultures for each treatment. *P < 0.05 significantly different versus naïve and KBR-treated cultures.

