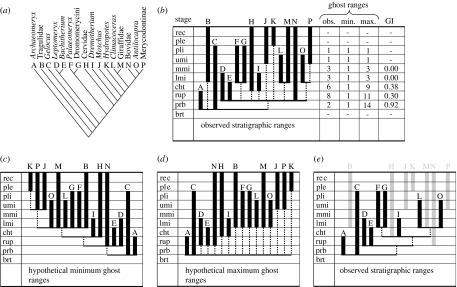
Figure 1.
Comparing a phylogeny and fossil dates to infer ghost ranges. (a) Example phylogeny of Ruminantia (Gentry & Hooker 1988). Taxa are assigned letters A to P for simplicity. (b) Cladogram in (a) plotted onto observed stratigraphic ranges (black vertical bars) to reveal the locations of ghost ranges (broken vertical lines). Values for the Gap Index (GI) are calculated by scaling the number of ghost ranges in each stratigraphic interval between the minimum and maximum possible (see (c,d); Wills 1999). The distribution of stratigraphic data that yields the (c) smallest and (d) largest number of ghost ranges for each interval. (e) The observed distribution of ghost ranges when omitting the contribution of lineages that persist to the Recent (grey bars). brt, Bartonian; prb, Priabonian; rup, Rupelian; cht, Chattian; lmi, Lower Miocene; mmi, Middle Miocene; umi, Upper Miocene; pli, Pliocene; ple, Pleistocene; rec, Recent.

