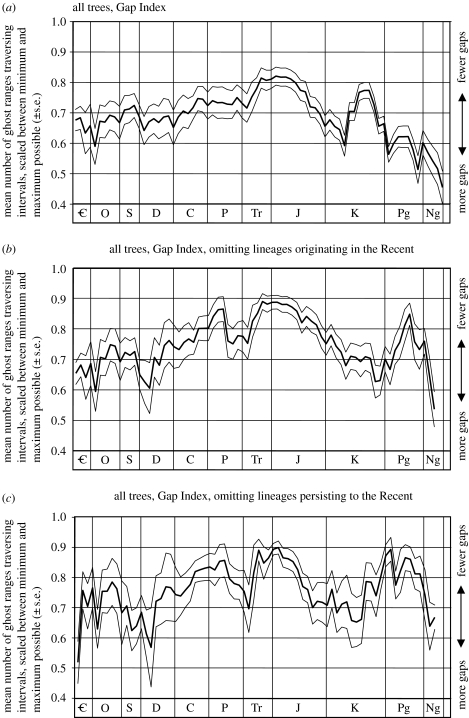
Figure 2.
How common are ghost ranges in individual stratigraphic stages? Data based on 1000 cladograms, encompassing all taxa. Data are filtered to exclude those cladograms where the range of possible gap values is less than 6 for a given interval. (a) Mean number of observed gaps±s.e., scaled between the maximum (1.0) and minimum (0.0) number of gaps for each tree's distribution of range data (i.e. Gap Index). Low values indicate gappier intervals. (b) As in (a), but weeding out ghost ranges subtended between one or more taxa not known as fossils. This controls for one interpretation of the ‘pull of the Recent’. (c) As in (a), but weeding out ghost ranges subtended between one or more taxa persisting to the Recent (i.e. known from the extant biota). This controls for a more restrictive interpretation of the pull of the Recent.

