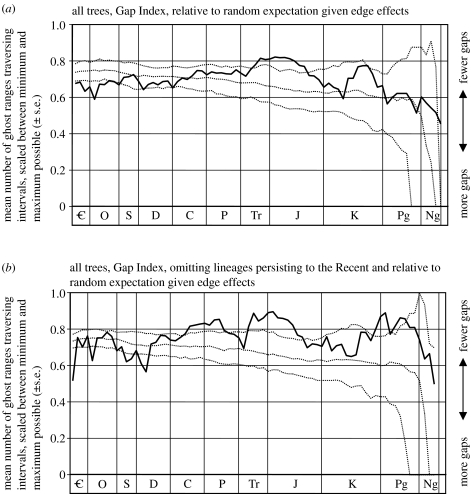
Figure 3.
Is the pattern of GI through time significantly different from that expected for randomly redated cladograms with the same properties as our sample (see text for further explanation)? All 1000 trees were randomly redated in absolute age, while retaining the relative ages of their constituent lineages. Two-hundred Monte Carlo simulations were run to yield 95% CIs above and below the median (dotted lines). Observed patterns of GI as solid line. (a) All lineages, including those persisting to the Recent. (b) Weeding out the contribution of lineages persisting to the Recent.

