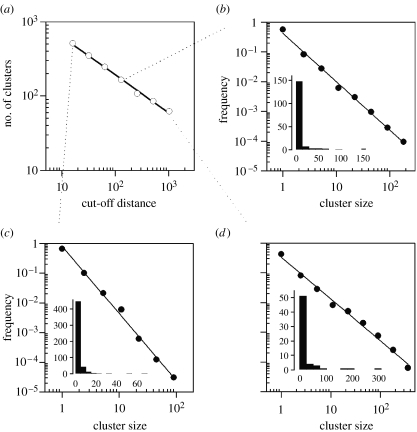
Figure 3.
(a) Power-law relationship between the cut-off distances applied and the number of resulting clusters in 2005. Only nests east of the dashed line in figure 1a are analysed. (b–d) Power-law (R2 always greater than 0.99) distribution of nest cluster sizes created through cut-offs of 16, 128 and 1024 m in (b), (c) and (d), respectively. Inset histograms show the same data in lineal–lineal axes binned in intervals of 5, 15 and 25 nests for (b), (c) and (d), respectively. See figures 4–6 in the electronic supplementary material for the other study years.

