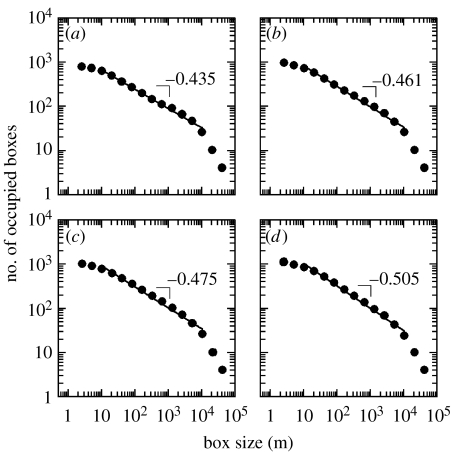
Figure 4.
Distribution of nests across scales. Log–log plot of the box-counting analyses, showing a power-law relationship between box side length and the number of occupied boxes for each year (R2 always greater than 0.98). Only nests to the east of the dashed line in figure 1a are analysed. (a–d) correspond to data for the different study years ordered from 2002 to 2005. See figure 3 in the electronic supplementary material for comparing results using all the nests in the study area.

