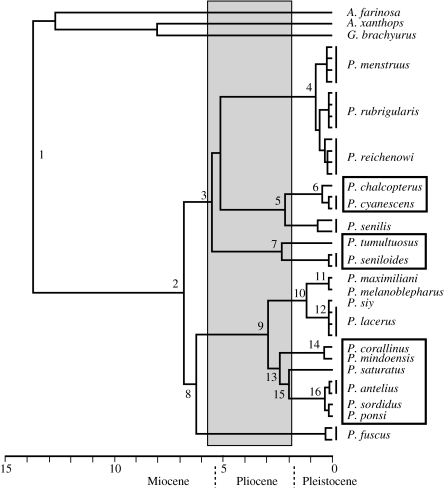
Figure 4.
Bayesian Multidivtime chronogram based on the combined ND2 and cyt b datasets. Nodes 1 and 2 are fixed calibration points derived from a Bayesian Multidivtime analysis of RAG-2 data. Time scale is in millions of years. Numbered nodes correspond to those of table 1. Montane clades are shown in boxes. Shaded area shows estimated window of time during which montane/lowland vicariance occurred.

