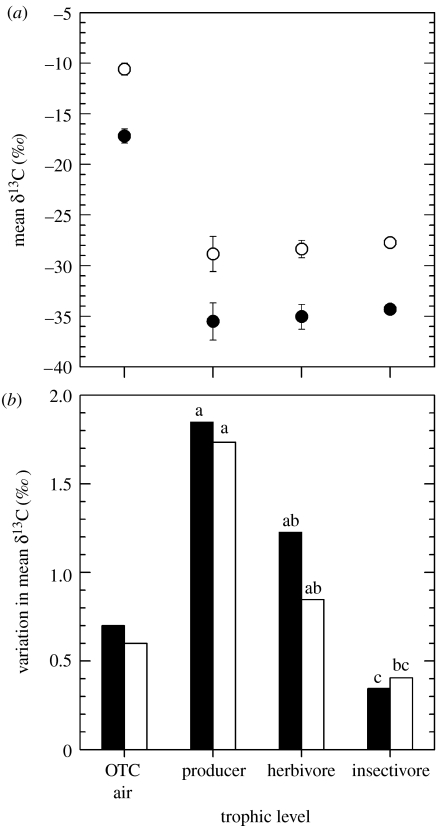
Figure 1.
δ13C values for experimental growth environment and across trophic levels; symbols and bar fills correspond to relatively heavy (open) or light (closed) CO2 treatment sources. (a) Points (mean±1 s.d.) indicate δ13C values for CO2 of open top chamber (OTC) air and tissues at each trophic level. Note OTC air treatment difference is reflected at each trophic level. (b) Bars indicate standard deviations of mean δ13C values measured for CO2 of OTC air and tissues at each trophic level. Bars labelled with different lower case letters are significantly different.

