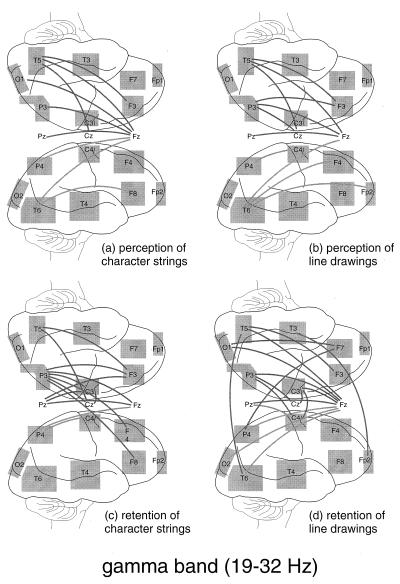
Figure 5.
Enhanced coherence in the γ range (19–32 Hz) during retention and perception intervals (P < 0.05 or better). In both the visual and the verbal task, the topographic pattern during perception intervals (a and b) were similar to that during retention intervals (c and d). γ range coherence patterns were also similar between tasks. Compared with the θ patterns (Fig. 3), γ band coherence-increases involved a higher percentage of ipsilateral electrode pairs.

