Figure 1.
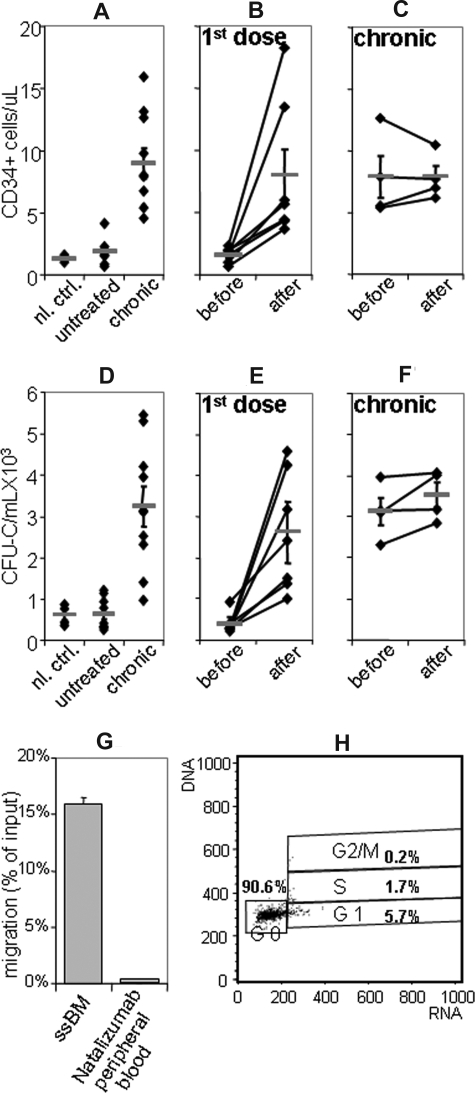
Elevated numbers of circulating HSPCs in the blood of natalizumab-treated MS patients. (A,D) Circulating HSPCs in healthy controls, not natalizumab-treated MS patients and long-term natalizumab-treated MS patients: Circulating CD34+ cells (1.8 ± 0.4/μL, P = .36 vs control) and CFU-C (638 ± 128/mL, P = .4 vs control) were normal in MS patients before the first natalizumab infusion (“untreated”) and significantly elevated in patients who had received at least 5 prior doses of natalizumab, measured immediately before application of the next dose (“chronic”; 9.0 ± 1.2/μL CD34+ cells, 3243 ± 332/mL CFU-C, P < .005 vs control). (Normal controls [“nl. ctrl.”]: 1.3 ± 0.1/μL CD34+ cells, 608 ± 129/mL CFU-C, on the left.) (B,E) First-dose natalizumab patients: After the first natalizumab infusion (“after”), peripheral blood CD34+ cells and CFU-C were significantly increased over pretreatment values (“before”; 1.6 ± 0.2/μL vs 8.0 ± 2.1/μL CD34+ cells, 414 ± 161/mL vs 2560 ± 726/mL CFU-C, P < .005). (C,F) Chronic natalizumab patients: Renewed natalizumab infusion (“after”) in “chronic” natalizumab recipients did not result in additional mobilization, compared with CD34+ cell and CFU-C values just before that infusion (7.9 ± 1.7/μL vs 7.9 ± 0.9/μL CD34+ cells, P = .99; 3133 ± 335/mL vs 3525 ± 305/mL CFU-C, P = .27). CD34+ cells/μL (A-C) or CFU-C/mL (D-F) are plotted on the y-axis. Each diamond represents values from one patient (for CFU-C: mean values from replicates from one patient); bars and whiskers indicate mean values plus or minus SEM. (G) CFU-C migration. In contrast to normal BM HSPCs, peripheral blood CFU-C from natalizumab recipients did not migrate toward SDF-1 in in vitro transwell assays (P < .001). (H) Cell-cycle status of natalizumab-mobilized HSPCs. natalizumab-mobilized CD34+ cells were almost exclusively quiescent and overwhelmingly in G0 phase of cell cycle (flow cytometric histogram; RNA displayed on the x-axis, DNA on the y-axis).

