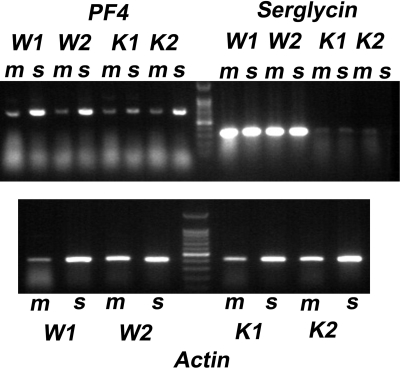
Figure 7.
mRNA expression of PF4, serglycin, and actin in bone marrow and spleen of WT and SG−/− cells. mRNA was extracted from bone marrow (m) and spleen (s) of 2 WT (W1 and W2) and 2 KO (K1 and K2) mice. The gel shows the RT-PCR products. Top panel: mRNA for PF4 and SG; marker is the 100-bp ladder. Bottom panel: actin mRNA.

