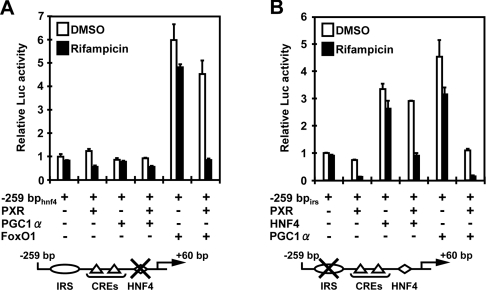
Figure 3. Repression of the G6Pase promoter through insulin-response signal and HNF4 sites.
The −259 bphnf4 and −259 bpirs G6Pase promoters were co-transfected with pCR3/hPXR and/or pcDNA3/mFoxO1, pCR3/hHNF4 or pCR3/hPGC1α, and the reporter activity was measured as described in the Experimental section. (A) The −259 bphnf4 promoter bearing the mutation of the HNF4 site, and (B) the −259 bpirs promoter having the mutation of the IRS site. pRL-CMV was always co-transfected as the control. Relative fold activities were calculated by taking the activity of the cells that were transfected by the reporter plasmid only in the presence of DMSO as 1. Results are means±S.D. for three experiments.

