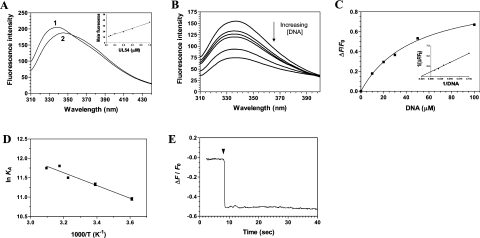
Figure 3. Titration of the cytomegalovirus DNA polymerase with DNA.
(A) Background-corrected fluorescence emission spectra of the enzyme. 1, Purified protein in 50 mM Tris/HCl and 50 mM potassium acetate (pH 7.5); 2, Purified protein after a 2 h exposure to an 8 M solution of urea at 25 °C. Fluorescence spectra were recorded at an excitation wavelength of 290 nm. The molar fluorescence of the protein is also displayed in the right-hand corner. Various concentrations of the purified protein were assayed in 50 mM Tris/HCl and 50 mM potassium acetate (pH 7.5). Excitation was performed at 290 nm, and emission was monitored at 338 nm. (B) Increasing concentrations of a DNA substrate of 30 nt encompassing the cytomegalovirus immediate-early promoter sequence were added to a 1 μM solution of the enzyme in binding buffer (20 mM Tris/HCl, pH 7.5, 50 mM NaCl and 10 mM MgCl2) and the emission spectrum was scanned from 310 to 440 nm. (C) A saturation isotherm can be generated from these results by plotting the change in fluorescence intensity at 338 nm as a function of added DNA. A double-reciprocal plot of the saturation isotherm is shown in the right-hand corner. (D) Thermodynamic parameters of the interaction between DNA and the cytomegalovirus DNA polymerase. Binding reactions were performed at various temperatures, and the respective association constants were evaluated. A van't Hoff plot for the interaction between DNA and the protein is shown. The effect of temperature on the association constant was evaluated at pH 7.5. (E) Kinetic analysis of real-time binding of DNA to the protein. A 1 μM solution of the enzyme was incubated with 100 μM DNA. Emission was monitored for 40 s at 338 nm, and excitation was performed at 290 nm.

