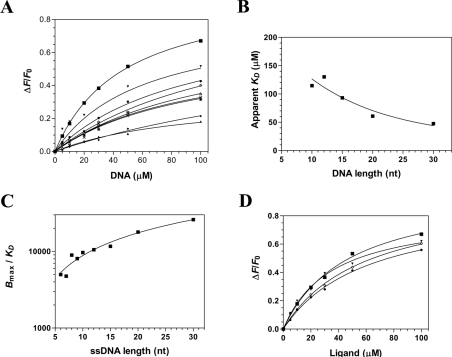
Figure 4. Characterization of the interaction between DNA and the catalytic subunit of the cytomegalovirus DNA polymerase.
(A) Affinity of the enzyme for DNA of 30 nt (■), 20 nt (▼), 15 nt (●), 12 nt (◇), 10 nt (Δ), 9 nt (X), 8 nt (*), 7 nt (♦) and 6 nt (▲). Increasing concentrations of DNA were added to a 1 μM solution of the enzyme and the emission spectrum was scanned from 310 to 440 nm upon excitation at 290 nm. Saturation isotherms can be generated from these results by plotting the change in fluorescence intensity at 338 nm as a function of added DNA. (B) Interaction of the enzyme with DNA of various lengths. The apparent Kd values were plotted as a function of substrate length. (C) The specificity of binding was also monitored as a function of the length of the various DNA molecules used in the binding assays. (D) The binding of various substrates was monitored by fluorescence spectroscopy. Increasing concentrations of a DNA substrate of 30 nt encompassing the cytomegalovirus immediate-early promoter sequence (■), a DNA substrate corresponding to the complement of the cytomegalovirus immediate-early promoter sequence (▼), a DNA substrate of 30 nt of random sequence (●), and an RNA substrate of 30 nt corresponding to cytomegalovirus immediate-early promoter sequence (◇) were used in the binding assays.

