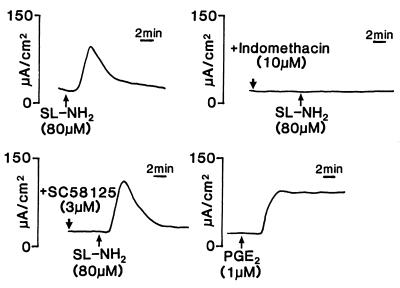
Figure 2.
Representative tracings of the Isc response of rat jejunum, to the serosal addition of SL-NH2 (80 μM) in the presence or in the absence of indomethacin (10 μM), SC-58125 (3 μM) and to the serosal addition of PGE2 (1 μM). The scale for time and Δ Isc (in μA/cm2) is shown respectively to the right and to the left of each tracing. All panels show a tracing for an individual tissue preparation that is representative of six independently conducted experiments.

