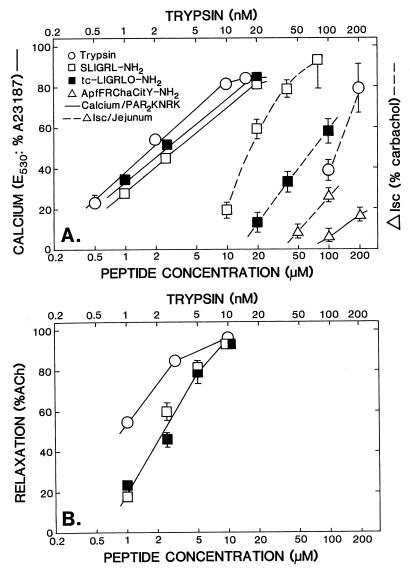
Figure 3.
Concentration-effect curves for PAR-APs and trypsin. (A). The PAR2-KNRK calcium assay and the Isc assay and (B) the AR assay. The three bioassay responses: (i) Δ Isc, (A) (right-hand ordinate, Δ Isc in percentage of carbachol response) broken lines; (ii) PAR2-KNRK cell calcium signaling, (A) (left-hand ordinate, E530 in percentage of A23187 response) solid lines; and (iii) AR, (B) (left-hand ordinate, in percentage of acetylcholine response; %ACh) were measured for increasing concentrations of PAR-APs (□, SL-NH2, ▪, tc-NH2, ▵, Cit-NH2; and ○, trypsin) as outlined in Methods. The concentrations of trypsin (nM) are shown on the upper abcissa. Each data point represents the average response (± SEM bars) observed at each concentration for three to six independently conducted experiments with tissues or cells derived from two to six different animals or cell culture preparations. Error bars smaller than the symbols are not shown.

