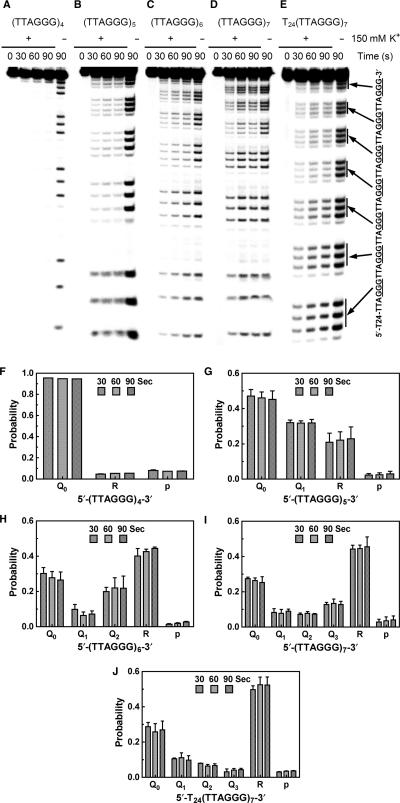
Figure 3.
(A–E) Representative gels showing DMS footprint of 5′-32P-labeled (TTAGGG)4, (TTAGGG)5, (TTAGGG)6, (TTAGGG)7 and T24(TTAGGG)7. DMS treatments were carried out for 0, 30, 60 and 90 s, respectively in the presence (+) or absence (–) of 150 mM K+. (F–J) Quantification of the footprints showing the probability of G-quadruplex formation at different positions (Qi, where the subscript indicates the number of TTAGGG repeats at the 3′ side of the G-quadruplex), the probability of being in the relaxed form (R) of the oligonucleotides and the probability of a GGG triplet being attacked (p). Results represent the mean of two experiments for (TTAGGG)4 and three experiments for the rest oligonucleotides with standard derivation.

