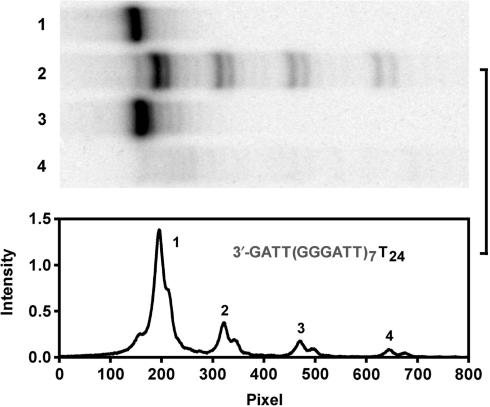
Figure 6.
Distribution of G-quadruplex formation at different positions in T24(TTAGGG)7TTAG detected by T4 polymerase digestion. Top panel: gel electrophoresis of hydrolysis products. Lane 1: T24(TTAGGG)7TTAG without digestion; 2: hydrolysis products of T24(TTAGGG)7TTAG; 3: T24(TTAGGG)7TTAG with the (TTAGGG)7 randomized without digestion; 4: hydrolysis products of T24(TTAGGG)7TTAG with the (TTAGGG)7 randomized. Bottom panel: Densitometry scans of lane 2 in the top panel.

