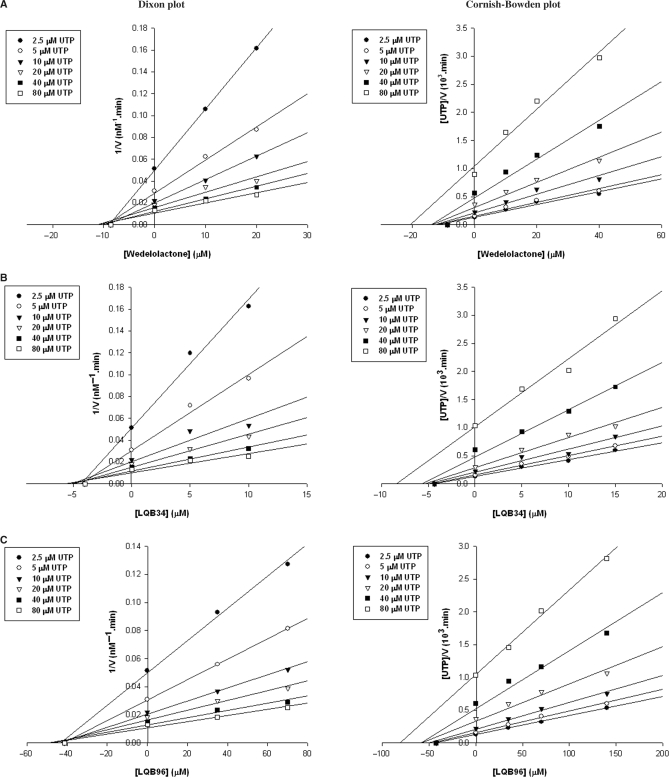
Figure 4.
Evaluation of inhibition kinetic parameters of coumestan compounds with regard to UTP substrate. Reaction velocities were measured at increasing concentrations of UTP substrate (2.5–80 μM) on poly rA-U12 template/primer (0.25 μM) in the absence or presence of increasing concentrations (5–140 μM) of the indicated inhibitor. Panels A, B and C depict the Dixon and Cornish-Bowden plots for wedelolactone, LQB34 and LQB96, respectively. Both plots display similar intercept profiles on the x-axis indicating a noncompetitive mode of inhibition with regard to UTP. The Ki values corresponded to 8.4, 4.2 and 42 μM for wedelolactone, LQB34 and LQB96, respectively.

