Figure 1.
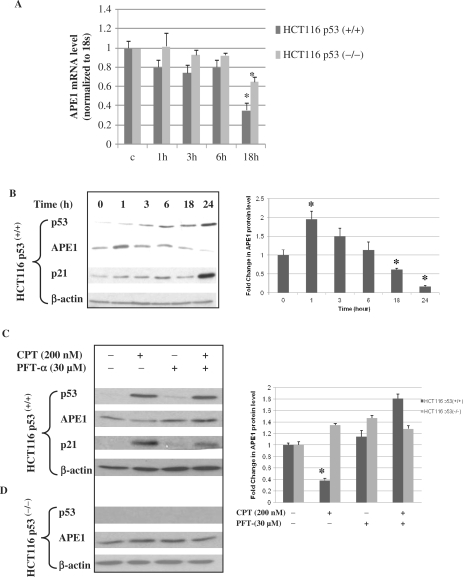
Repression of APE1 gene expression in HCT116 p53(+/+) cells after CPT treatment. (A) Real-time RT-PCR analysis of APE1 mRNA from HCT116 p53(+/+) and HCT116 p53(−/−) cells at indicated time points after CPT treatment. Results correspond to mean ± SD from three separate experiments. (B) After treating HCT116 p53(+/+) cells with CPT (200 nM), as described under Materials and Methods section, total lysates of cells harvested at the indicated times were analyzed for p53, APE1 and p21 levels by western blotting. β-actin was used as the loading control. Right panel, graphical representation of APE1 protein level (normalized to β-actin) at indicated time points after CPT treatment. Results correspond to mean ± SD from three separate experiments. (C and D) HCT116 p53(+/+)or p53(−/−) cells were treated with CPT (200 nM) for 24 h in the presence or absence of the p53 inhibitor PFT-α and total lysates were analyzed for p53, APE1 and p21 levels by western blotting. β-actin was used as the loading control. Right panel, graphical representation of APE1 protein level (normalized to β-actin) after treatment with CPT or PFT-α. Results correspond to mean ± SD from three separate experiments; *P < 0.05.

