Figure 5.
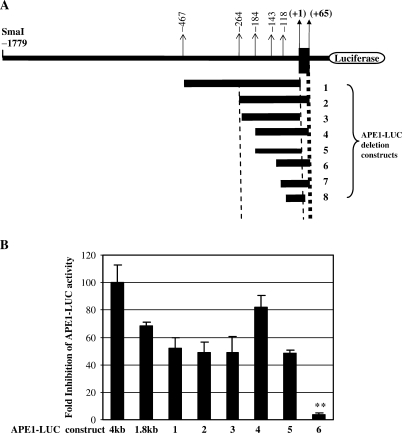
(A) Schematic diagram of the APE1 promoter 5′ regulatory region showing the location of DNA fragments cloned upstream of the luciferase-coding region. The nucleotides are numbered 5′(−) and 3′(+) from the transcription start site (+1). (B) p53(−/−) cells were cotransfected with expression plasmid for WTp53 (0.1 μg) or empty vector and individually for APE1 promoter–reporter plasmids (0.5 μg) 1–8, as indicated in (A). Luciferase activity was measured 48 h after transfection and normalized for the amount of protein. Fold inhibition was calculated as the ratio of luciferase activity from empty vector transfected versus p53-transfected cells; the results represent the mean ± SD in five independent experiments performed in duplicate; *P < 0.001.

