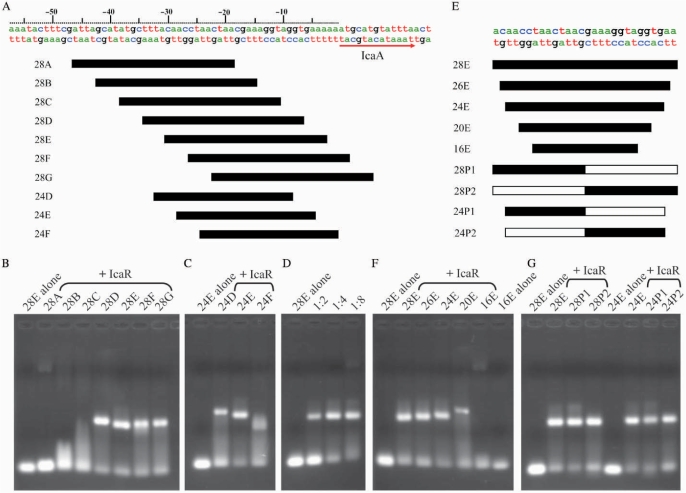
Figure 2.
Electrophoretic mobility shift assay (EMSA) of IcaR binding to the ica operator. (A) Part of the DNA sequence of ica operon of S. epidermidis and diagrams of the dsDNA probes. (B) The EMSA of IcaR binding to different 28-mer dsDNA fragments of the ica operator. (C) The EMSA of IcaR binding to different 24-mer dsDNA fragments of the ica operator. (D) The EMSA of IcaR with different DNA ratio of the 28E probe. The 28E probe was mixed with 1:2, 1:4 and 1:8 molar ratio of IcaR (monomer), respectively. (E) Sequences of the core region of the ica operator and DNA probes. 28P1, 28P2, 24P1 and 24P2 are artificial panlindromic DNA probes of the ica operator. The white bars of the palindromic DNA probes indicate the palindromic sequences to the black bars. (F) The EMSA of IcaR binding to different size probes of the ica operator. (G) The EMSA of IcaR binding to different palindromic probes of the ica operator. A 1:4 molar ratio of DNA and IcaR (monomer) was used in the EMSA experiments except in (D). A 2 mg/mL BSA was included in all EMSA experiments to avoid nonspecific interaction between IcaR and the DNA probes.

