Figure 4.
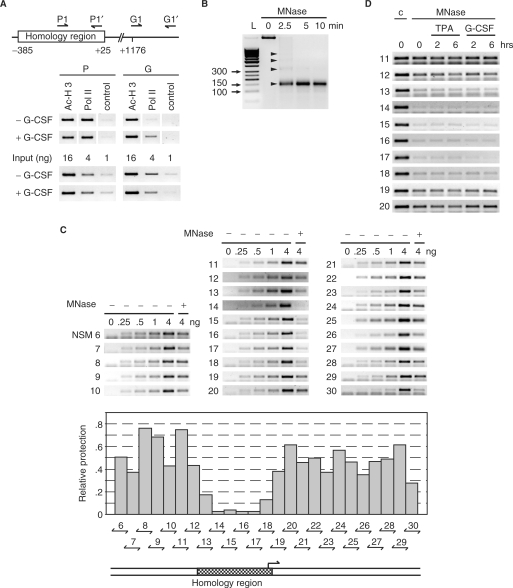
The homology region of the MAD1 promoter possesses open chromatin. (A) Upper panel: schematic representation of the positions of the primers used for the ChIP experiments relative to the homology region. Lower panel: chromatin immunoprecipitations were performed with antibodies specific for the indicated proteins on lysates of U937 cells treated with or without G-CSF (10 ng/ml) for 30 min. For control serial dilutions of the input were analyzed. (B) U937 cells were lyzed in F-buffer, nuclei prepared and digested with micrococcal nuclease (MNase) for the indicated times. DNA was then extracted and analyzed by agarose gel electrophoresis. The arrowheads identify mono-, di-, tri-, and tetra-nucleosomes. L: molecular size markers. (C) MNase or untreated DNA from exponentially growing U937 cells was used in PCR analysis with the indicated primer pairs. Untreated DNA was titrated (0,.25,.5, 1, and 4 ng) for the control PCR reactions and compared to 4 ng of Mnase-treated DNA. The agarose gels with the PCR products are shown in the top panel. The middle panel shows a quantification of the signal obtained from the MNase-treated DNA compared to the control signals. The bottom panel shows the position of the homology region relative to the analyzed promoter region. (D) U937 cells were grown exponentially or treated for the indicated times with TPA or G-CSF as indicated. MNase or untreated DNA was amplified with primer pairs that span the homology region and neighboring genomic DNA.

