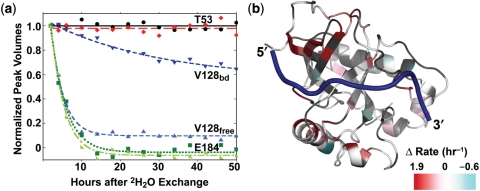
Figure 4.
Exponential decay curves of selected hydrogen exchange data showing that some residues have similar rates in free and bound whether slow (T53) or fast (E184) (a). Residue V128 is an example of a residue with very different rates between free and bound. Mapping the difference in the free and bound rates shows that residues in red near the 5′-end of the DNA and in α1 have faster hydrogen exchange rates in the free state (b).

