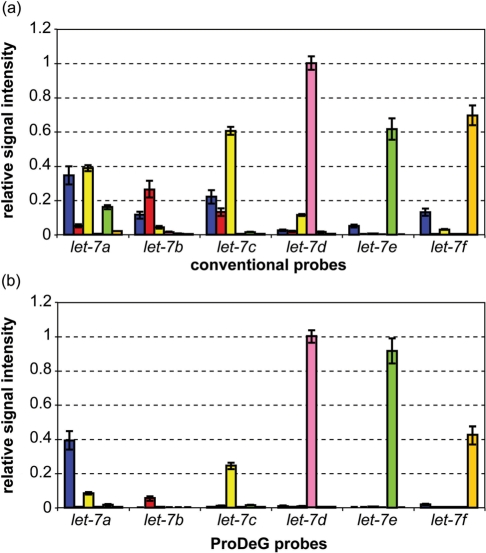
Figure 4.
Relative signal intensities of the let-7 family with spiked-in RNA sequences are shown using perfectly matched conventional (control) sequences as probes (a) and ProDeG designed probes (b) at 40°C. Each x axis category indicates probes used while the corresponding series shows the relative probe intensities normalized with highest intensity value. Spiked-in sample notations are as follows: blue bars, let-7a; red bars, let-7b; yellow bars, let-7c; pink bars, let-7d; lime bars, let-7e and orange bars, let-7f.

