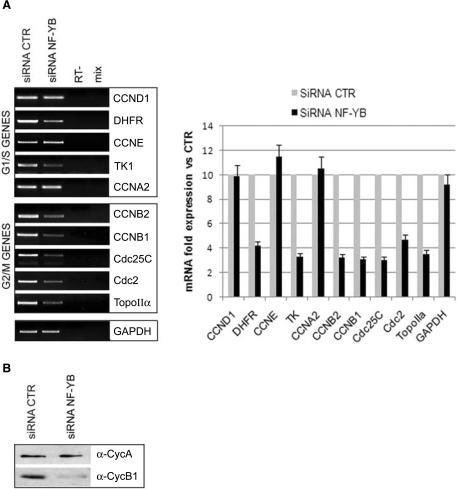
Figure 4.
Expression analysis of NF-Y targets in NF-YB-silenced HCT116 cells. (A) RNA expression levels of the indicated NF-Y target genes relative to RNA levels in control and NF-YB-silenced cells (left panel). Quantification of the RT-PCRs, relative to control siRNA expression levels, is plotted in the right panel. Error bars indicate standard deviations. (B) Cyclin A and Cyclin B1 expression analysis of total extracts of HCT116 non-targeting control or NF-YB siRNA transfected cells.

