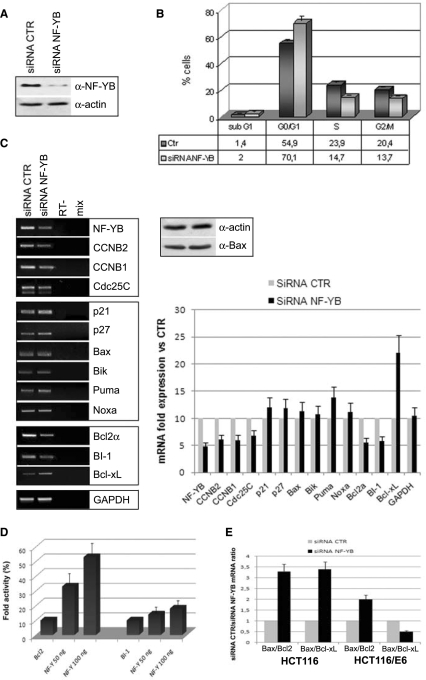
Figure 7.
Role of p53 in apoptosis induction. (A) Expression levels of NF-YB and actin in HCT116/E6 upon NF-YB silencing. (B) Cell cycle progression analysis by FACS of control and NF-YB-silenced HCT116/E6 cells. Error bars indicate standard deviations. (C) Left panel: RT-PCR analysis of G2/M, pro- and anti-apoptotic genes upon NF-YB siRNA transfection. PCR amplified genes are indicated and their quantitation, relative to control expression levels, is plotted in the right lower panel. Right upper panel: total extracts subjected to western immunoblotting using anti-bax and anti-actin antibodies. (D) Dose–response analysis (50–100 ng) of NF-Y in HCT116/E6 cells with Bcl-2 reporter. Error bars indicate standard deviations (E) The histogram represents the Bax/Bcl-2 and Bax/Bcl-XL mRNA ratios in HCT116 and HCT116/E6 NF-YB-silenced cells.

