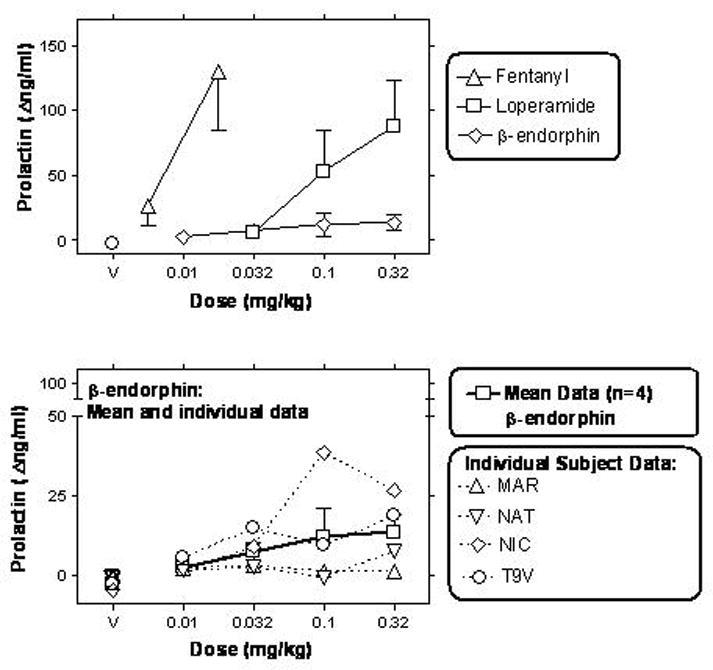
Figure 2.

Dose-effect curves for β-endorphin, loperamide and fentanyl, re-plotted from a time of peak effect (15 min post-administration). Upper panel: Mean dose-effect curves (n=4) for each aforementioned compound. Lower panel: Individual subject dose-effect curves for β-endorphin (n=4; re-plotted from above panel). Abscissae are doses in mg/kg (points above “V” represent values obtained after vehicle administration); other details as in Fig. 1. Note ordinate axis break and axis range in lower panel.
