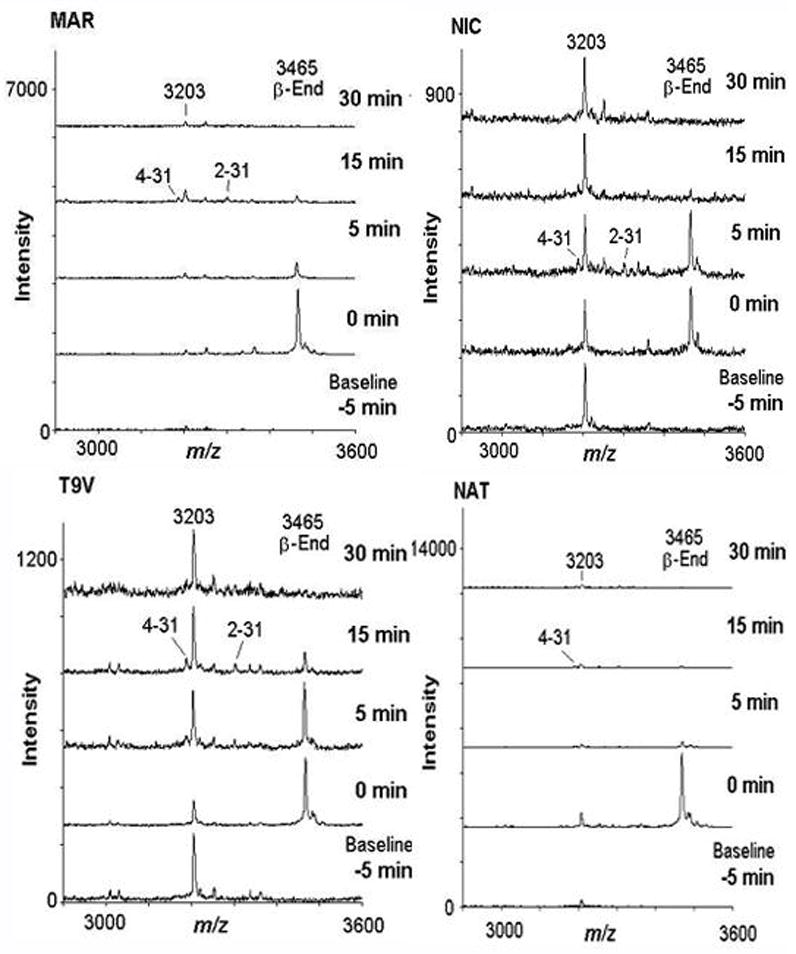
Figure 6.

In vivo biotransformation of i.v. β-endorphin (0.1 mg/kg): representative mass spectra for each subject (n=4). The baseline sample was obtained 5 minutes prior to β-endorphin administration, and remaining samples were obtained 0, 5, 15, and 30 minutes after administration, where time 0 was immediately after β-endorphin injection. For clarity, spectra at 1 and 2 minutes are omitted from this Figure. Spectra were obtained in linear mode, with a m/z range of 1,000 to 10,000, and represent averages of 150–200 laser shots. For clarity, spectra were truncated to a m/z range of 2900 to 3600. For data processing, involving peak normalization (see Fig. 7), at least three technical replicates for each time-point were analyzed; mass spectra shown represent a single replicate each. Abscissa: Peak intensity; ordinate: m/z for individual peak.
