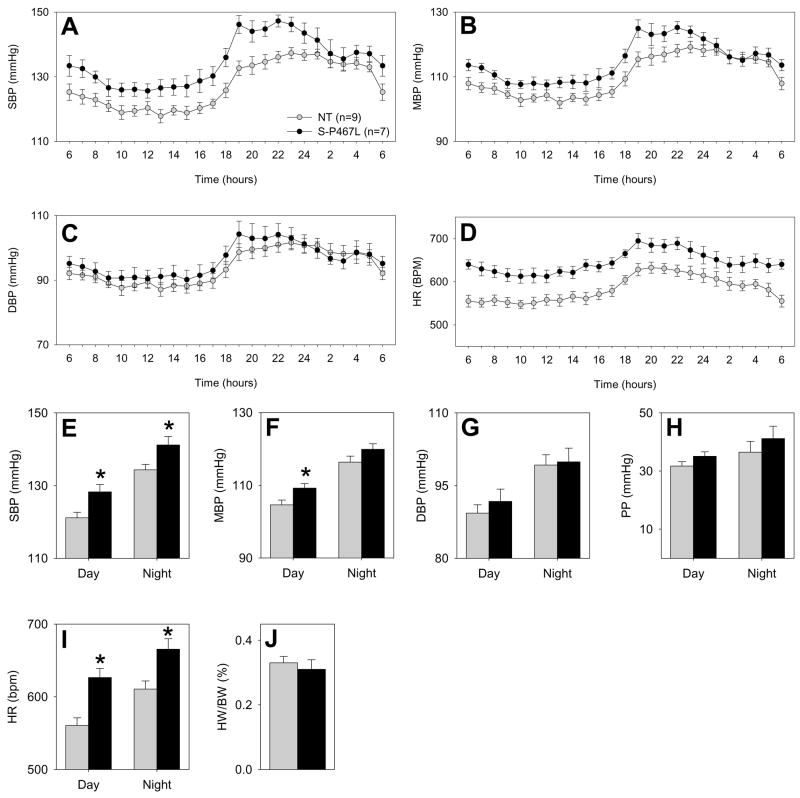
Figure 6. Dominant Negative PPARγ Causes Hypertension.
Hourly systolic (A), mean (B), diastolic (C) blood pressure, and heart rate (D) tracing of S-P467L mice (filled circle, N=7) and their NT littermates (grey circle, N=9) over 9 consecutive 24 hour periods was examined. The hourly blood pressure for each 60 minute period across all 9 days of measurement were combined to provide the average hourly BP and HR recording. Daytime (6am to 6pm) and nighttime (6pm to 6am) averages for SBP (E), MBP (F), DBP (G), pulse pressure (PP, H) and HR (I) over 9 days. J. Heart weight to body weight ratio. NT, grey bar; S-P467L, black bar. *, P<0.05 vs. NT. Error bars represent SEM.

