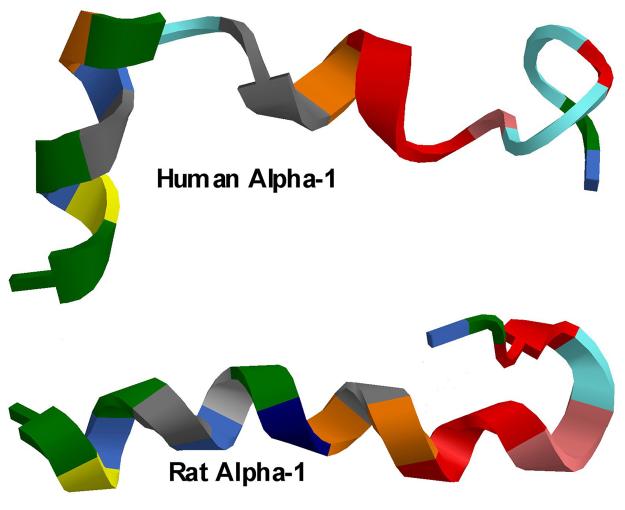
Figure 3.
A comparison of 3D projection of the 23 amino acid sequence in the first external loop of the α1 subunit of the Na/K-ATPase of the high affinity ouabain binding isoform (human, upper cartoon) and low affinity ouabain binding isoform (Rat, lower cartoon). Plots were generated using Chem 3D Ultra v. 10.0 (Cambridgesoft.com). Colors indicate individual amino acids.

