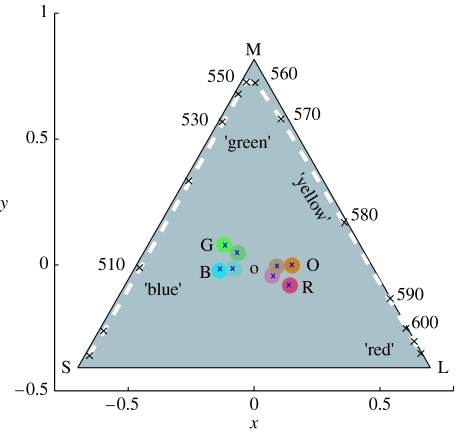
Figure 2.
Chromaticity coordinates of the colours used in these experiments (table 2 and §2). Saturation is defined as being proportional to the distance from the origin, and hue to the angle relative to the x-axis (table 2). Locations of the eight colours used are plotted (crosses) within circles that approximate to the actual colour used. These colours are saturated and unsaturated versions of orange (O), blue (B), red (R) and green (G). Orange/blue and red/green are complementary pairs of colours. The dashed line plots the monochromatic locus in this receptor space.

