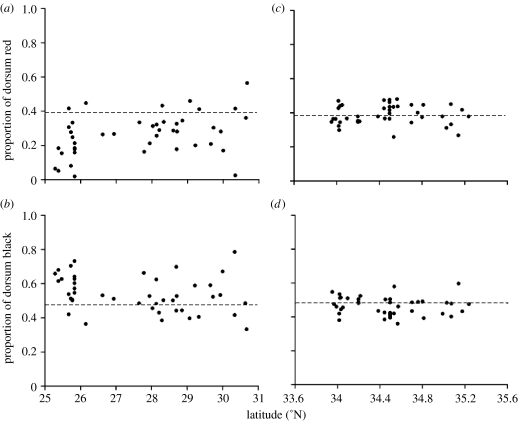
Figure 3.
Geographical variation in two diagnostic traits for L. t. elapsoides (mimics) from (a,b) Florida (deep sympatry) and (c,d) North Carolina (edge sympatry). Each dot represents the trait value for an individual L. t. elapsoides. The dashed horizontal line indicates the mean trait value for the local model.

