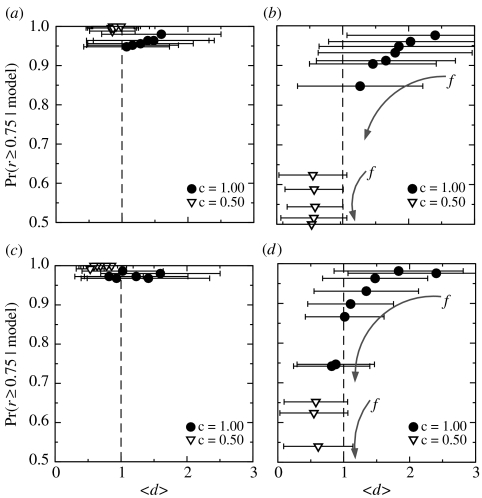
Figure 5.
Effect of aggregation of taxonomic species into trophic species on the conclusion of diet contiguity in empirical food webs. We show here the fraction of model-generated food webs with uncentred correlation coefficient r≥0.75 against the average ratio d which compares the magnitudes of model and empirical z-score vectors. Each model food web is a realization of the generalized niche model with differing specified levels of diet contiguity c and differing fractions of aggregated species f. (a) Motifs S1–S5 and (b) motifs D1–D5: we lump species which are closest together in niche value. This is equivalent to lumping together species which are likely to share predators. (c) Motifs S1–S5 and (d) motifs D1–D8: we lump species which have the greatest overlap in both prey and predators. This is equivalent to the procedure which occurs in the collection of empirical food-web data when lumping similarly behaving species into a single trophic species. We see little effect upon motifs S1–S5 but pronounced effects for motifs D1–D8. As f increases (as indicated by the arrows), the agreement between the model webs and the empirical data decreases for any fixed value of c, mirroring the effect of decreasing diet contiguity c. It is therefore unlikely that the strong agreement we observe between the empirical data and niche model would be due to aggregation of taxonomic species into trophic species, at least by the two mechanisms examined here. All error bars are two standard deviations of the observed values.

