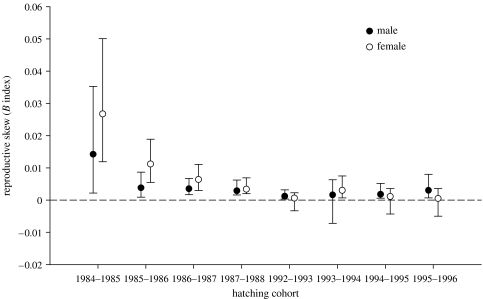
Figure 2.
Relationship between male and female reproductive skew (B index, Nonacs 2000) within a hatching cohort. Despite a male sex ratio bias, no difference in reproductive skew was found between the sexes. Error bars represent 95% CI. The dashed line indicates the B value for randomly distributed reproduction.

