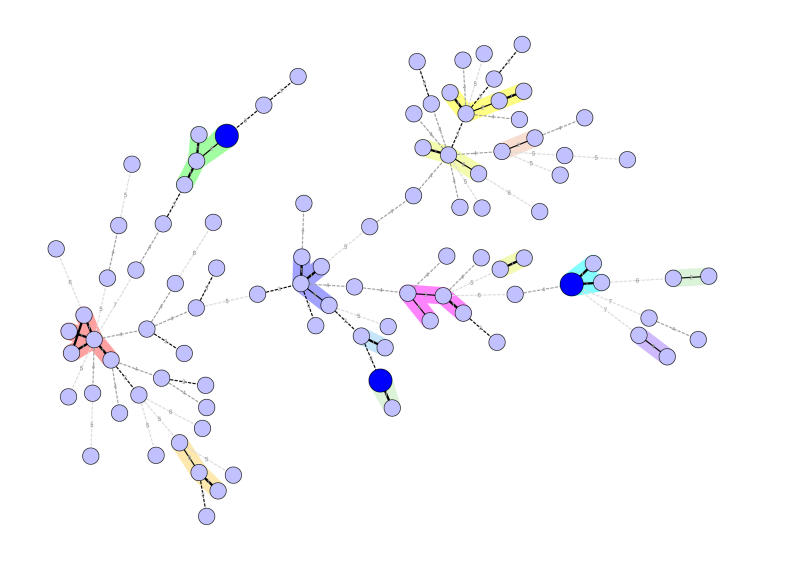
Fig. 1.
Minimal spanning tree of 99 presumably unrelated A. fumigatus isolates based on microsatellite data. The tree was generated using the multi-state categorical similarity coefficient. Each circle represents a unique genotype. The size of the circle corresponds to the number of isolates with the same genotype. Genotypes connected through a shaded background differ by a maximum of 2 out of 9 markers. The numbers correspond to the number of different markers between the genotypes. No less than 96 different genotypes were discriminated. Data are taken from de Valk et al. (2005).

