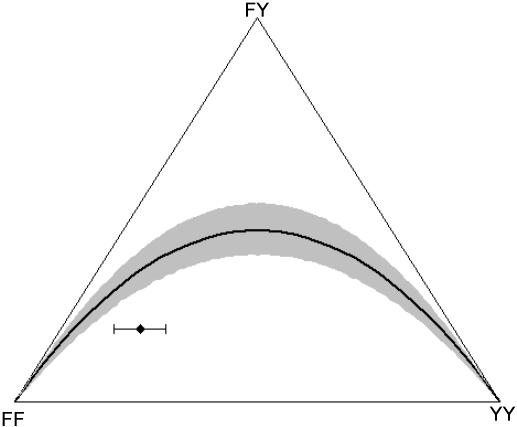
Figure 3. De Finetti diagram showing the genotype distribution of W. bancrofti microfilariae generated from a given underlying adult worm allele frequency, qW, taken from villages prior to the introduction of chemotherapy.
A full explanation of the De Finetti diagram is given in [24]. The black diamond represents the value originating from the observed data (with  , and FIT = 0.44), and the error bars indicate the uncertainty in genotype distribution stemming from the values of qW (0.21, 0.32) that were estimated from the null (random) model (Figure 2). Y indicates the allele coding for tyrosine at position 200 of β-tubulin that is associated with benzimidazole (BZ) resistance in nematodes of livestock, and F denotes the allele (coding for phenylalanine) indicative of BZ susceptibility. The solid-black curve represents the Hardy-Weinberg equilibrium (HWE). The null model generating microfilarial allele frequencies (see text) was used to investigate the range of sample microfilarial genotype distributions that could be obtained from a population exhibiting no excess inbreeding (i.e. assuming that the underlying adult parasite population would have values of
  ). Simulations mimic the same sampling scheme described in Schwab et al. The observed microfilarial genotype distribution falls outside the 95% confidence interval range (grey shaded area surrounding the HWE curve) generated by the null model, despite the uncertainty in the underlying qW estimates, indicating strong parasite inbreeding even before introduction of antifilarial combination therapy.

