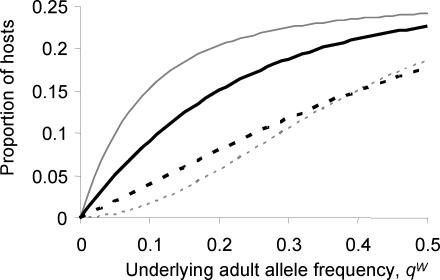
Figure 4. The impact of inbreeding on the relationship between the mean proportion of hosts harbouring microfilariae with one or two copies of allele Y and the (assumed) underlying adult worm allele frequency, qW.
The figure compares the proportion of hosts exhibiting microfilariae with allele Y (i.e. both heterozygous and homozygous YY microfilariae, solid lines) with that of hosts which have only microfilariae with the homozygous YY genotype (broken lines). Model outcomes are compared for two hypothetical parasite populations; the former (thin grey lines) without excess inbreeding (generated by the null model), and the latter (thick black lines) with the levels of inbreeding (FIS = 0.28,  ) observed in the Burkina Faso data. Simulations used the same sampling scheme described in Schwab et al.
[13] and assume an overall microfilarial prevalence of ∼25% (see text).

