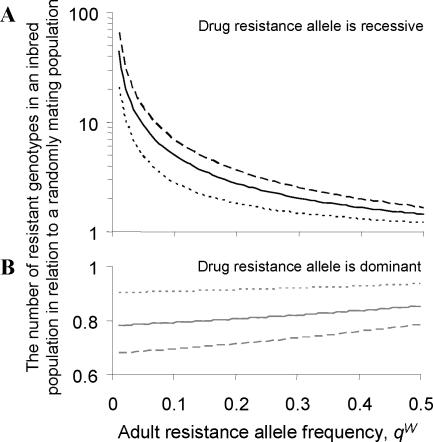
Figure 6. The impact of the observed level of parasite inbreeding on the production of resistant microfilariae.
The graph gives the relative change in the number of resistant genotypes in an inbred parasite population compared to that in a population at HWE. Results are shown for different resistance allele frequencies. The graph assumes that a known resistance allele is either recessive (A), black lines, or dominant (B), grey lines. The inbreeding coefficients are those reported in Figure 1: mean result (FIT = 0.44, solid line); upper 95% confidence limit (FIT = 0.68, dashed line); lower 95% confidence limit (FIT = 0.17, dotted line). The relative change in the number of resistant genotypes caused by parasite inbreeding is estimated as  in (A) and
  in (B).

