
Table 2. The extension of Wright's F-statistic to represent the hierarchical population structure of obligate parasites of humans, exemplified in this paper with Wuchereria bancrofti (adapted from [24] and [34]).
| Symbol | Definition |
| FIT | Correlation of alleles within individual worms relative to alleles drawn at random from the overall worm population (total deviation from the Hardy-Weinberg Equilibrium) |
| FIS | Correlation of alleles within individual worms relative to alleles drawn at random from the parasite infrapopulation (within host non-random mating) |

|
Correlation of parasite alleles within parasite infrapopulations relative to alleles drawn at random from parasites within the same village (parasite genetic differentiation between hosts within villages) |

|
Correlation of parasite alleles within a village relative to alleles drawn at random from the overall worm population (parasite genetic differentiation between villages) 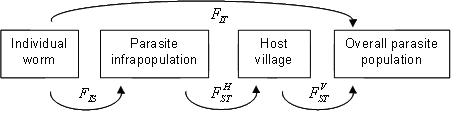
|
The table includes a graphical representation of the different F-statistics.