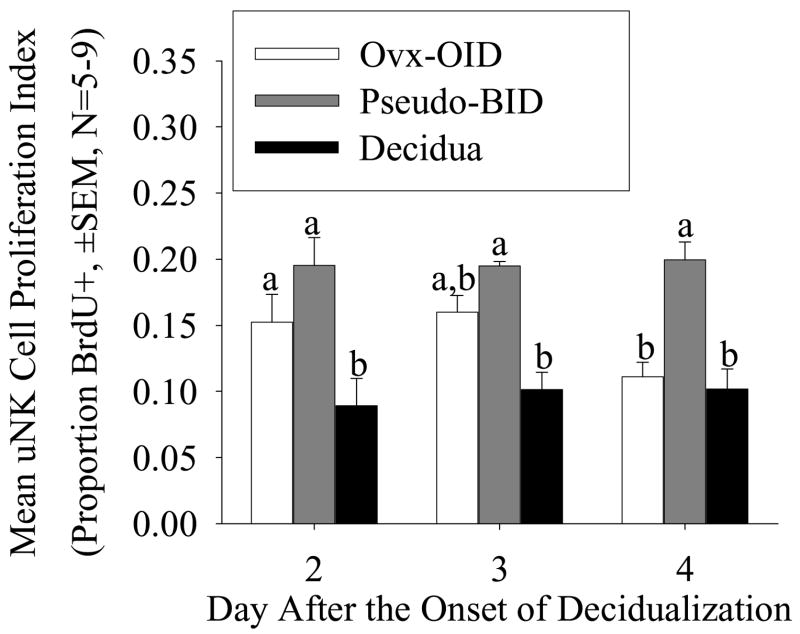
Figure 6.
Graph showing the mean (± SEM, N=5–6) uNK cell proliferation index (proportion of uNK cells staining positive for BrdU) in the mouse Ovx-OID plus Pseudo-BID deciduomas and decidua on Days 2, 3 and 4 after the onset of decidualization. Bars with different are significantly different (P <0.01).

